Finding conjunctions#
Abstract: VirES currently has the ability to search for conjunctions between only Swarm Alpha & Bravo. These are times when the spacecraft are flying near to each other. Here we show how the Python interface can be used to find these conjunctions. VirES defines conjunctions as times when the angular separation between two spacecraft (based on geographic latitude & longitude) is below a given threshold.
See also:
API reference: https://viresclient.readthedocs.io/en/latest/api.html#viresclient.SwarmRequest.get_conjunctions
Point-and-click dashboard:
Swarm_notebooks/dashboards/04_Conjunctions.ipynb(link TBD)
Using other tools?
For auroral-related studies, you will probably want to use the AuroraX Conjunction Search which lets you search conjunctions between multiple ground and space programs. You can use the PyAuroraX package to do this programmatically, which is currently not installed in VRE. You can install it temporarily on the fly from within a notebook with, e.g.:
!pip install pyaurorax

from aurorax import conjunctions
Interface example#
# Display current version numbers used
%load_ext watermark
%watermark -i -v -p viresclient,pandas,xarray,matplotlib
Python implementation: CPython
Python version       : 3.11.6
IPython version      : 8.18.0

viresclient: 0.14.1
pandas     : 2.1.3
xarray     : 2023.12.0
matplotlib : 3.8.2
import datetime as dt
import matplotlib.pyplot as plt

from viresclient import SwarmRequest
Use the .get_conjunctions() method to search for conjunctions. This takes as its inputs:
start_time,end_time: the search inteval (as ISO-8601 strings, or asdatetimeobjects)threshold: the maximum allowable angular separation in degreesmission1,mission2: mission name of the first/second spacecraft (currently only Swarm is allowed)spacecraft1,spacecraft2: the spacecraft identifiers (currently only A/B allowed)
The object returned from .get_conjunctions() can be loaded as a Pandas Dataframe or as an Xarray Dataset, just as with other data queries. For example, searching within September 2021:
request = SwarmRequest()
conjs = request.get_conjunctions(
    start_time="2021-09-01",
    end_time="2021-10-01",
    threshold=1,
    spacecraft1="A",
    spacecraft2="B",
    mission1="Swarm",
    mission2="Swarm"
)
conjs = conjs.as_dataframe()
conjs
| AngularSeparation | |
|---|---|
| Timestamp | |
| 2021-09-04 11:55:06 | 0.875864 |
| 2021-09-04 12:42:04 | 0.777631 |
| 2021-09-04 13:29:02 | 0.626864 |
| 2021-09-04 14:16:01 | 0.531057 |
| 2021-09-04 15:02:58 | 0.379247 |
| ... | ... |
| 2021-09-30 11:00:46 | 0.492314 |
| 2021-09-30 11:47:45 | 0.582722 |
| 2021-09-30 12:34:42 | 0.723411 |
| 2021-09-30 13:21:40 | 0.814804 |
| 2021-09-30 14:08:38 | 0.953246 |
119 rows × 1 columns
Using identified conjunctions#
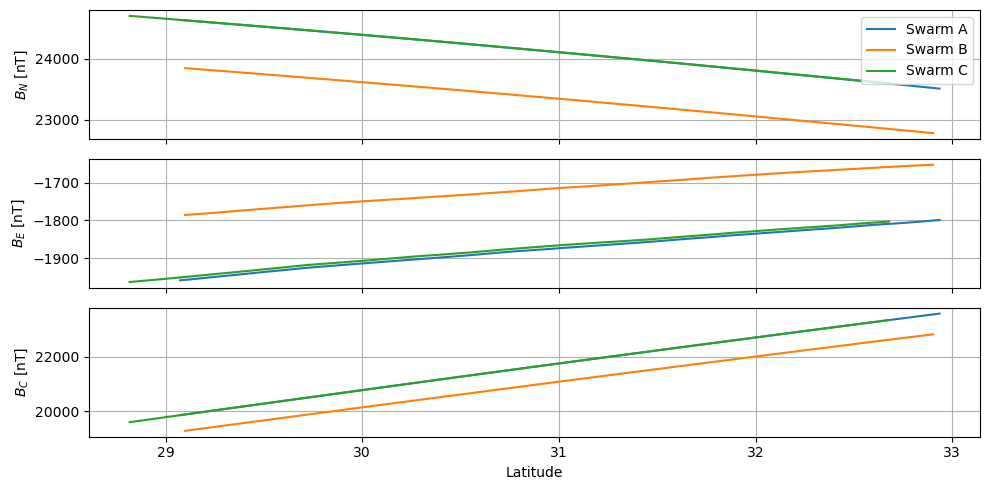
We can now use the identified time instances to extract data from around those moments. Let’s pick the first conjunction found and create a one-minute time window around it:
time = conjs.index[0].to_pydatetime()
time0 = time - dt.timedelta(seconds=30)
time1 = time + dt.timedelta(seconds=30)
time0, time1
(datetime.datetime(2021, 9, 4, 11, 54, 36),
 datetime.datetime(2021, 9, 4, 11, 55, 36))
Now let’s pull the magnetic high rate (50Hz) measurements from this period:
# Make three consecutive requests and store the data within the dictionary, ds_set
ds_set = {}
for spacecraft in ("A", "B", "C"):
    request = SwarmRequest()
    request.set_collection(f"SW_OPER_MAG{spacecraft}_HR_1B")
    request.set_products(measurements=["B_NEC"])
    data = request.get_between(time0, time1, asynchronous=False, show_progress=False)
    ds_set[spacecraft] = data.as_xarray()
ds_set["A"]
<xarray.Dataset>
Dimensions:     (Timestamp: 3000, NEC: 3)
Coordinates:
  * Timestamp   (Timestamp) datetime64[ns] 2021-09-04T11:54:36.017820416 ... ...
  * NEC         (NEC) <U1 'N' 'E' 'C'
Data variables:
    Spacecraft  (Timestamp) object 'A' 'A' 'A' 'A' 'A' ... 'A' 'A' 'A' 'A' 'A'
    Radius      (Timestamp) float64 6.803e+06 6.803e+06 ... 6.804e+06 6.804e+06
    Latitude    (Timestamp) float64 32.94 32.93 32.93 ... 29.08 29.08 29.07
    Longitude   (Timestamp) float64 -15.23 -15.23 -15.23 ... -15.24 -15.24
    B_NEC       (Timestamp, NEC) float64 2.351e+04 -1.799e+03 ... 1.986e+04
Attributes:
    Sources:         ['SW_OPER_MAGA_HR_1B_20210904T000000_20210904T235959_070...
    MagneticModels:  []
AppliedFilters: []spacecraft = ("A", "B", "C")
colors = ("tab:blue", "tab:orange", "tab:green")
# Loop through each spacecraft and plot in a different colour
fig, axes = plt.subplots(nrows=3, sharex=True, figsize=(10,5))
for sc, color in zip(spacecraft, colors):
# Extract latitude and B_NEC vector for each spacecraft
lat = ds_set[sc]["Latitude"]
B_N = ds_set[sc]["B_NEC"].sel(NEC="N")
B_E = ds_set[sc]["B_NEC"].sel(NEC="E")
B_C = ds_set[sc]["B_NEC"].sel(NEC="C")
axes[0].plot(lat, B_N, color=color, label=f"Swarm {sc}")
axes[1].plot(lat, B_E, color=color)
axes[2].plot(lat, B_C, color=color)
# Adjust labelling
axes[0].legend(loc="upper right")
axes[0].set_ylabel("$B_N$ [nT]")
axes[1].set_ylabel("$B_E$ [nT]")
axes[2].set_ylabel("$B_C$ [nT]")
axes[2].set_xlabel("Latitude")
for ax in axes:
ax.grid()
fig.tight_layout()

The pair of Alpha and Charlie fly together at the same altitude so measure a very similar field. Bravo, in this instance, is flying in the opposite direction (in this part of the mission, the orbits are counter-rotating so there are many conjunctions with the spacecraft flying towards each other), but at a higher altitude and so measuring a weaker field.
