Conjunctions (TOLEOS)#
%load_ext watermark
%watermark -i -v -p viresclient,pandas,xarray,matplotlib,cartopy
Python implementation: CPython
Python version       : 3.11.6
IPython version      : 8.18.0

viresclient: 0.15.0
pandas     : 2.1.3
xarray     : 2023.12.0
matplotlib : 3.8.2
cartopy    : 0.22.0
import datetime as dt

import matplotlib.pyplot as plt
import numpy as np
from viresclient import SwarmRequest
Product information#
The MM_OPER_CON_EPH_2_ product contains conjunction information between Swarm (A, B, C), CHAMP, GOCE, GRACE (1, 2), and GRACE-FO (1, 2).
The product is implemented in VirES as two collections, each available as a single flat time series.
MM_OPER_CON_EPH_2_:crossover contains the list of times where satellite ground-tracks overlap within a ~7 hour window.
MM_OPER_CON_EPH_2_:plane_alignment contains much rarer events, where the planes of different spacecraft are aligned
request = SwarmRequest()
for collection in (
    "MM_OPER_CON_EPH_2_:crossover",
    "MM_OPER_CON_EPH_2_:plane_alignment",
):
    print(f"{collection}:\n{request.available_measurements(collection)}\n")
MM_OPER_CON_EPH_2_:crossover:
['time_1', 'time_2', 'time_difference', 'satellite_1', 'satellite_2', 'latitude', 'longitude', 'altitude_1', 'altitude_2', 'magnetic_latitude', 'magnetic_longitude', 'local_solar_time_1', 'local_solar_time_2']

MM_OPER_CON_EPH_2_:plane_alignment:
['time', 'altitude_1', 'altitude_2', 'ltan_1', 'ltan_2', 'ltan_rate_1', 'ltan_rate_2', 'satellite_1', 'satellite_2']
Fetching data#
Crossovers#
Let’s fetch all the available conjunctions for a given day.
Note that the start_time and end_time specified are used for a full interval query over both time_1 and time_2 given in the outputs.
request = SwarmRequest()
request.set_collection("MM_OPER_CON_EPH_2_:crossover")
request.set_products(request.available_measurements("MM_OPER_CON_EPH_2_:crossover"))
data = request.get_between(
    dt.datetime(2020, 1, 1),
    dt.datetime(2020, 1, 2),
)
df = data.as_dataframe()
df
| local_solar_time_1 | altitude_2 | latitude | magnetic_latitude | altitude_1 | magnetic_longitude | Spacecraft | longitude | local_solar_time_2 | time_2 | time_difference | satellite_1 | satellite_2 | |
|---|---|---|---|---|---|---|---|---|---|---|---|---|---|
| time_1 | |||||||||||||
| 2019-12-31 16:45:34.507031296 | 12.813727 | 445802.184339 | 87.321728 | 79.949318 | 508386.037694 | -164.456295 | - | -168.631028 | 5.517517 | 2020-01-01 00:03:20.865398528 | 26266.358365 | GF1 | SWC |
| 2019-12-31 16:45:34.666273280 | 12.822272 | 445817.275119 | 87.330964 | 79.956628 | 508384.174138 | -164.497178 | - | -168.540829 | 5.523574 | 2020-01-01 00:03:29.977781248 | 26275.311505 | GF1 | SWA |
| 2019-12-31 16:45:58.498234368 | 12.808170 | 445802.184832 | 87.322763 | 79.946058 | 508285.501449 | -164.469981 | - | -168.714116 | 5.518642 | 2020-01-01 00:03:20.801171712 | 26242.302943 | GF2 | SWC |
| 2019-12-31 16:45:58.642820352 | 12.815265 | 445817.254541 | 87.331274 | 79.952162 | 508283.850034 | -164.509020 | - | -168.645621 | 5.523248 | 2020-01-01 00:03:29.901976576 | 26251.259161 | GF2 | SWA |
| 2019-12-31 17:32:44.852499968 | 0.806052 | 464173.845073 | -87.324172 | -79.455668 | 522002.918063 | 14.152966 | - | -0.411375 | 17.518367 | 2020-01-01 00:50:00.517710848 | 26235.665210 | GF1 | SWC |
| ... | ... | ... | ... | ... | ... | ... | ... | ... | ... | ... | ... | ... | ... |
| 2020-01-01 23:42:29.863429888 | 4.383929 | 508318.284479 | 81.399341 | 75.124965 | 511607.216872 | 146.831766 | - | 38.339964 | 2.264293 | 2020-01-02 01:49:40.551429632 | 7630.688001 | SWB | GF1 |
| 2020-01-01 23:43:26.628039168 | 6.837217 | 445127.722214 | 77.902092 | 71.743591 | 511293.312109 | 142.500846 | - | 42.564400 | 2.561690 | 2020-01-02 03:59:58.525515520 | 15391.897473 | SWB | SWA |
| 2020-01-01 23:43:39.701632768 | 6.874009 | 445042.331540 | 77.089844 | 70.954621 | 511208.234498 | 141.708566 | - | 43.203973 | 2.607960 | 2020-01-02 03:59:37.480210944 | 15357.778578 | SWB | SWC |
| 2020-01-01 23:59:39.406749952 | 6.175955 | 435473.994296 | 21.148917 | 14.544932 | 507422.300094 | 134.574062 | - | 59.698567 | 3.974184 | 2020-01-02 02:11:45.781679616 | 7926.374931 | GF2 | SWC |
| 2020-01-01 23:59:59.915086080 | 6.186112 | 435703.475318 | 23.980608 | 17.345313 | 507614.183522 | 134.913629 | - | 59.668240 | 3.977859 | 2020-01-02 02:12:29.624203264 | 7949.709113 | GF1 | SWC |
5408 rows × 13 columns
Pairs of conjunctioning spacecraft are defined with short designations in the satellite_1 and satellite_2 variables:
df["satellite_1"].unique()
array(['GF1', 'GF2', 'SWB', 'SWC', 'SWA'], dtype=object)
df["satellite_2"].unique()
array(['SWC', 'SWA', 'SWB', 'GF2', 'GF1'], dtype=object)
Each conjunction has a start and end time defined with the time_1 and time_2 variables:
df.iloc[0:5][["time_2", "satellite_1", "satellite_2"]]
| time_2 | satellite_1 | satellite_2 | |
|---|---|---|---|
| time_1 | |||
| 2019-12-31 16:45:34.507031296 | 2020-01-01 00:03:20.865398528 | GF1 | SWC |
| 2019-12-31 16:45:34.666273280 | 2020-01-01 00:03:29.977781248 | GF1 | SWA |
| 2019-12-31 16:45:58.498234368 | 2020-01-01 00:03:20.801171712 | GF2 | SWC |
| 2019-12-31 16:45:58.642820352 | 2020-01-01 00:03:29.901976576 | GF2 | SWA |
| 2019-12-31 17:32:44.852499968 | 2020-01-01 00:50:00.517710848 | GF1 | SWC |
We can select all the conjunctions containing a given satellite:
df_SWA = df.where((df["satellite_1"] == "SWA") | (df["satellite_2"] == "SWA")).dropna()
df_SWA
| local_solar_time_1 | altitude_2 | latitude | magnetic_latitude | altitude_1 | magnetic_longitude | Spacecraft | longitude | local_solar_time_2 | time_2 | time_difference | satellite_1 | satellite_2 | |
|---|---|---|---|---|---|---|---|---|---|---|---|---|---|
| time_1 | |||||||||||||
| 2019-12-31 16:45:34.666273280 | 12.822272 | 445817.275119 | 87.330964 | 79.956628 | 508384.174138 | -164.497178 | - | -168.540829 | 5.523574 | 2020-01-01 00:03:29.977781248 | 26275.311505 | GF1 | SWA |
| 2019-12-31 16:45:58.642820352 | 12.815265 | 445817.254541 | 87.331274 | 79.952162 | 508283.850034 | -164.509020 | - | -168.645621 | 5.523248 | 2020-01-01 00:03:29.901976576 | 26251.259161 | GF2 | SWA |
| 2019-12-31 17:32:44.934890496 | 0.811638 | 464161.845406 | -87.328937 | -79.460015 | 522004.159533 | 14.136825 | - | -0.365544 | 17.521446 | 2020-01-01 00:50:09.627804672 | 26244.692912 | GF1 | SWA |
| 2019-12-31 17:33:08.975226624 | 0.802755 | 464161.901037 | -87.329375 | -79.454945 | 522106.188666 | 14.116901 | - | -0.498389 | 17.519267 | 2020-01-01 00:50:09.531093760 | 26220.555867 | GF2 | SWA |
| 2019-12-31 17:42:18.655843840 | 8.064305 | 445697.680298 | 84.623616 | 75.269785 | 511774.213962 | -175.176848 | - | 120.426718 | 1.733630 | 2020-01-01 00:02:09.084413952 | 22790.428566 | SWB | SWA |
| ... | ... | ... | ... | ... | ... | ... | ... | ... | ... | ... | ... | ... | ... |
| 2020-01-01 23:31:37.199038976 | 3.789605 | 463967.092769 | -85.252281 | -82.426605 | 524464.926293 | 30.386096 | - | 54.144711 | 3.136647 | 2020-01-02 00:10:47.848054528 | 2350.649018 | GF2 | SWA |
| 2020-01-01 23:36:50.826312448 | 17.280079 | 445355.973591 | 76.710613 | 80.903810 | 511401.685124 | -87.255342 | - | -115.750956 | 15.897388 | 2020-01-02 00:59:48.513515776 | 4977.687203 | SWB | SWA |
| 2020-01-01 23:41:14.676492288 | 8.571359 | 445591.642678 | 85.793936 | 79.420521 | 511872.512023 | 156.361396 | - | 21.364816 | 1.111731 | 2020-01-02 07:08:49.337390592 | 26854.660897 | SWB | SWA |
| 2020-01-01 23:41:47.813570304 | 7.710203 | 445578.775959 | 83.922645 | 77.564465 | 511777.132307 | 151.398185 | - | 31.918781 | 1.824534 | 2020-01-02 05:34:56.224296704 | 21188.410732 | SWB | SWA |
| 2020-01-01 23:43:26.628039168 | 6.837217 | 445127.722214 | 77.902092 | 71.743591 | 511293.312109 | 142.500846 | - | 42.564400 | 2.561690 | 2020-01-02 03:59:58.525515520 | 15391.897473 | SWB | SWA |
1657 rows × 13 columns
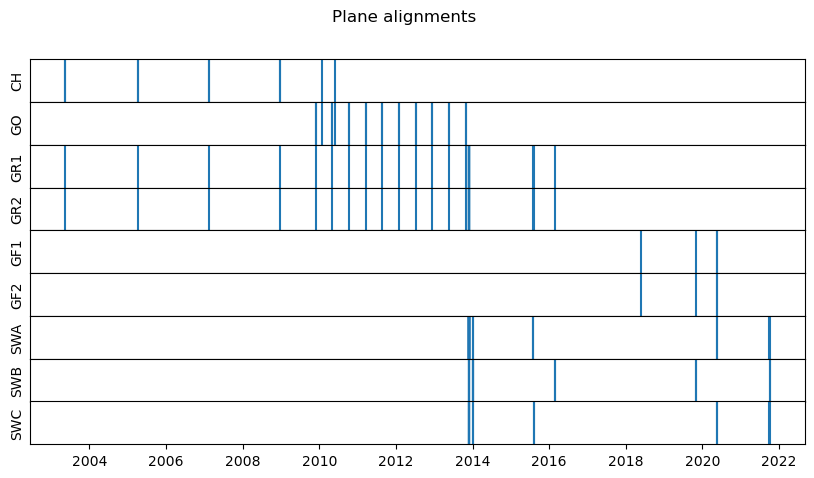
Plane alignments#
request = SwarmRequest()
request.set_collection("MM_OPER_CON_EPH_2_:plane_alignment")
request.set_products(
    request.available_measurements("MM_OPER_CON_EPH_2_:plane_alignment")
)
data = request.get_between(
    dt.datetime(2000, 1, 1),
    dt.datetime(2022, 1, 1),
)
df = data.as_dataframe()
df
| altitude_2 | altitude_1 | ltan_rate_1 | Spacecraft | ltan_rate_2 | ltan_1 | satellite_1 | satellite_2 | ltan_2 | |
|---|---|---|---|---|---|---|---|---|---|
| time | |||||||||
| 2003-05-11 10:10:03.145992192 | 488291.762308 | 400547.265815 | -0.091268 | - | -0.074543 | 16.684153 | CH | GR2 | 4.684153 |
| 2003-05-11 10:21:36.896242176 | 487617.059444 | 400527.975912 | -0.091268 | - | -0.074549 | 16.683406 | CH | GR1 | 4.683406 |
| 2005-04-08 16:07:15.667320192 | 469993.893995 | 361914.544690 | -0.091834 | - | -0.074332 | 0.629215 | CH | GR2 | 0.629215 |
| 2005-04-08 16:12:54.103234304 | 470666.606845 | 361913.083670 | -0.091834 | - | -0.074331 | 0.628855 | CH | GR1 | 0.628855 |
| 2007-02-14 05:07:14.704273408 | 481552.511743 | 350444.851771 | -0.092207 | - | -0.074526 | 10.255276 | CH | GR2 | 22.255276 |
| ... | ... | ... | ... | ... | ... | ... | ... | ... | ... |
| 2020-05-21 19:46:01.686648320 | 485113.048217 | 436300.307971 | -0.089979 | - | -0.074638 | 17.434235 | SWC | GF2 | 17.434235 |
| 2020-05-21 20:03:47.512773632 | 485000.585092 | 436330.337154 | -0.089979 | - | -0.074633 | 17.433122 | SWC | GF1 | 17.433122 |
| 2021-09-30 18:39:55.482117120 | 430878.908792 | 430877.890053 | -0.089902 | - | -0.090034 | 20.642289 | SWA | SWC | 20.642289 |
| 2021-10-03 13:41:11.625304576 | 431177.812782 | 503359.670523 | -0.085605 | - | -0.090089 | 8.390555 | SWB | SWC | 20.390555 |
| 2021-10-03 15:03:35.963726592 | 503289.814384 | 431054.450419 | -0.089954 | - | -0.085605 | 20.385697 | SWA | SWB | 8.385697 |
82 rows × 9 columns
def alignments(df, sat="SWA"):
    return df.where((df["satellite_1"] == sat) | (df["satellite_2"] == sat)).dropna()


sats = ("CH", "GO", "GR1", "GR2", "GF1", "GF2", "SWA", "SWB", "SWC")
fig, axes = plt.subplots(len(sats), 1, figsize=(10, 5), sharex=True)
empty = np.empty(df.index.shape)
empty[:] = np.nan
axes[0].plot(df.index, empty)
for sat, ax in zip(sats, axes):
    _df = alignments(df, sat=sat)
    for date in _df.index:
        ax.axvline(date)
    ax.set_yticks([])
    ax.set_ylabel(sat)
fig.subplots_adjust(hspace=0)
fig.suptitle("Plane alignments");